
Market Overview
warmMedian home price in Mapleton is about 14 % higher than the Utah average, while homes sit on the market roughly 60 % longer than the state‑wide norm.- •Median closed price is $599 K, up 24.8 % month‑over‑month, indicating strong price momentum.
- •Sale‑to‑list ratio is 99.2 %, showing buyers are willing to meet asking prices.
- •30‑year mortgage rates have risen from 6.10 % to 6.49 % over the past six months, adding cost pressure for buyers.
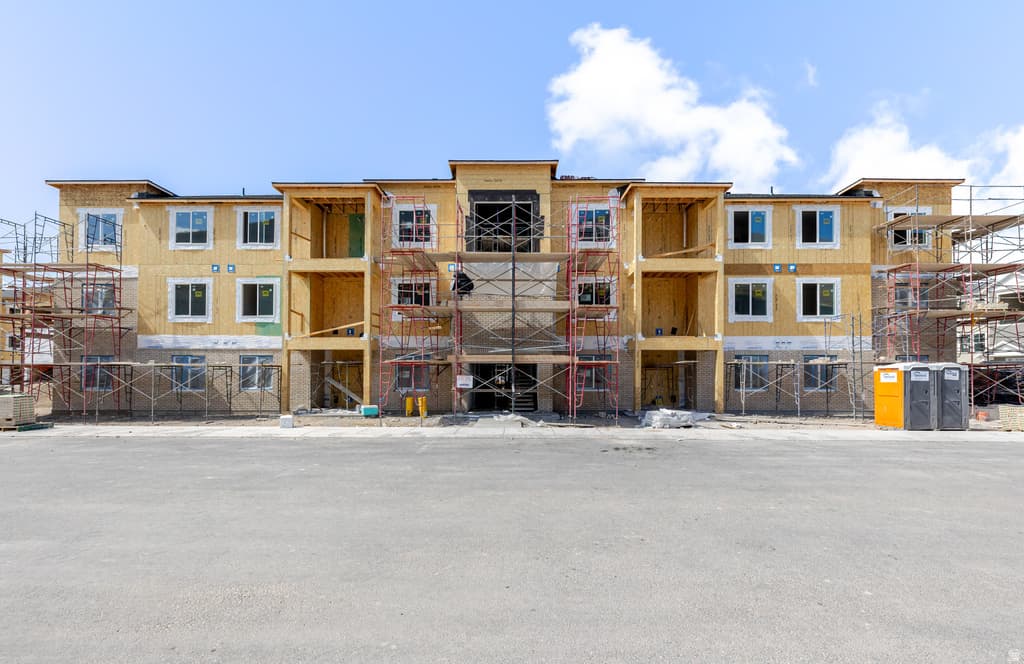
Featured Homes in Mapleton
Top-scoring active listings in Mapleton


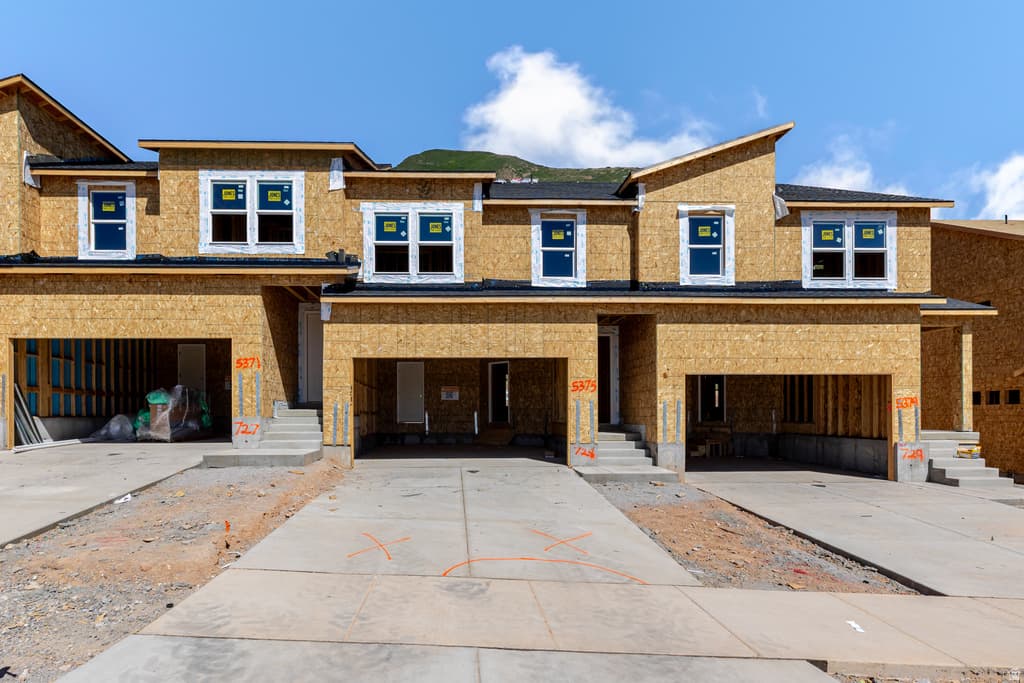


Deals & Lifestyle in Mapleton
Best-priced homes and the outdoor lifestyle you're after


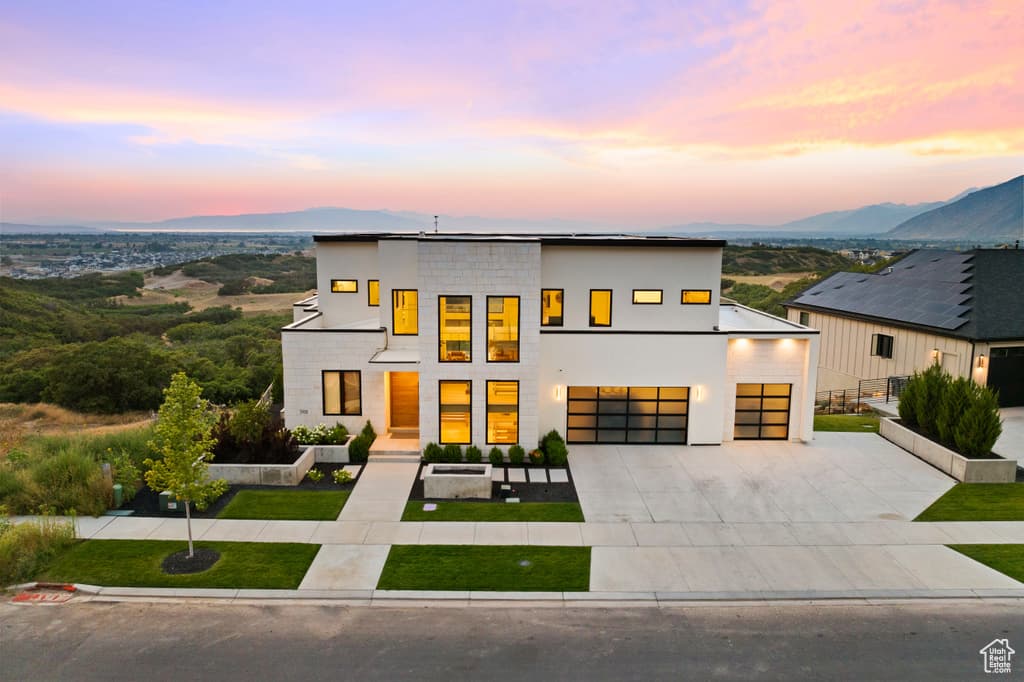
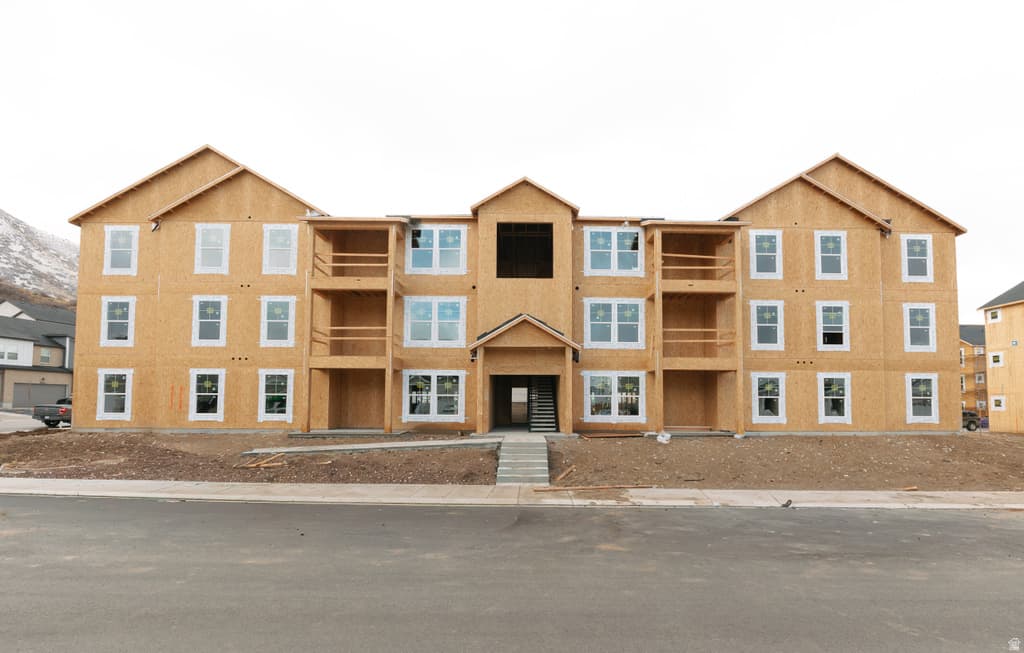
Highlights in Mapleton
Luxury, new construction, scenic views and more


Frequently Asked Questions About Mapleton Real Estate
As of July 2026, the median home price in Mapleton, Utah is $599,000, which is 14.1% above the Utah state median of $525,000. Home prices in Mapleton range from $85,900 to $6,802,100, with an average sale price of $813,280. These figures are based on recent closed transactions in the Mapleton real estate market.
Mapleton, Utah is currently a warm market that leans slightly toward sellers. Key indicators include an average sale-to-list price ratio of 99.2% and homes spending an average of 98 days on the market. Median home price in Mapleton is about 14 % higher than the Utah average, while homes sit on the market roughly 60 % longer than the state‑wide norm.
Homes in Mapleton, Utah spend an average of 98 days on the market before going under contract compared to the Utah state average of 61 days (59.9% above average). This gives buyers time to carefully evaluate options and negotiate terms. Properties that are priced competitively and show well tend to sell fastest.